China's exports move downstream: magnets take a growing share of export value, and from the mid-2010s China becomes a net importer of upstream feedstock, mainly from Myanmar. The shift starts before the 2012 white paper.
What we expected, and why
Our project framework's historical background describes the state turning against its own raw-material exports from 1999. The first export quota was meant to "encourage the export of high-value downstream products and discourage the export of raw material" (Tse, USGS, 2011, p. 6), followed by foreign-investment limits in 2002 and total-amount control in 2006 (Shen, Moomy and Eggert, 2020). From the mid-2010s China "increasingly imported feedstock, especially heavy rare earths from Myanmar" (Reuters, 2021). Because these instruments date from 1999–2006, we expected the downstream shift to begin before the white paper.
What would confirm it
Magnets (S4) take a rising share of China's rare-earth export value before 2012. China's net trade in upstream stages turns negative from the mid-2010s, with Myanmar as the main supplier.
What would contradict it
The shift appears only after the policy, or not at all.
Magnets' share of China's rare-earth export value (S1–S4) rose from 23% in 1995 to 47% in 2003, well before 2012. It dipped to 39–42% in 2010–11, jumped to 59% in 2012 and reached 82% in 2024.
China has been a net importer of ores (S1) by value every year since 2009. For compounds and oxides (S2) it became a net importer from 2018 in tonnes and from 2020 in value.
Myanmar supplied 56–77% of China's S2 imports (tonnes) every year from 2017. In 2011–16 it supplied at most 12%.
Verdict: Confirmed. The downstream shift started before 2012, as expected. The net-importer turn for compounds came later than "mid-2010s" (2018–20), and Myanmar shows up at the compounds stage (S2), not the ore stage.
H2 · China, Announcement vs instrumentNot testable yet
Declaratory policies (white papers, five-year plans, Made in China 2025) produce no breaks in trade series. Binding instruments do, within months and at the stage they target: the 2010 quota cut, the 2015 end of quotas, the 2023 technology ban, the 2025 export licensing.
What we expected, and why
Our project framework's historical background separates instruments that bind trade from statements of aims. The binding ones are the export quotas (1999, the roughly 40% cut in 2010) and their cancellation in 2015 after the WTO ruling. The statements are the white paper, which promised both "fair trade" and "restrictive measures", and Made in China 2025. The framework also notes that announced and actual quota output diverged (Tang and Morrison, 2012, p. 12). So we expected trade to respond to what is legally enforced, not to what is announced.
What would confirm it
Monthly Chinese exports at the targeted stage break within about 12 months of the 2010 quota cut and the 2015 end of quotas, but not around the white paper or Made in China 2025.
What would contradict it
Breaks do not line up with the type of instrument.
Test and data: Monthly China flows by stage around each event (±12 months), the coded event list, and the text analysis on How Beijing justified the shift. Our trade outputs so far are annual.
What we found
Not tested yet. The break tests need the monthly series, which is still pending.
The site's status table records a gap in the monthly China series from October 2012 to December 2015. That gap would also cover the months before the 2015 event.
Annual hints only: magnets' share of China's export value jumped from 39% to 59% between 2011 and 2012, after the 2010 quota cut. It did not move around 2015 (70% in 2014, 70% in 2015).
The text analysis already on the site shows the vocabulary changing in 2009–11, years before the 2015 instrument.
Two of the four instruments cannot show up in our data. The 2023 ban covers technology, not goods, and the 2025 licensing falls after BACI ends in 2024.
Verdict: Not testable yet.
H3 · The West, Sovereignty displacementPartly confirmed
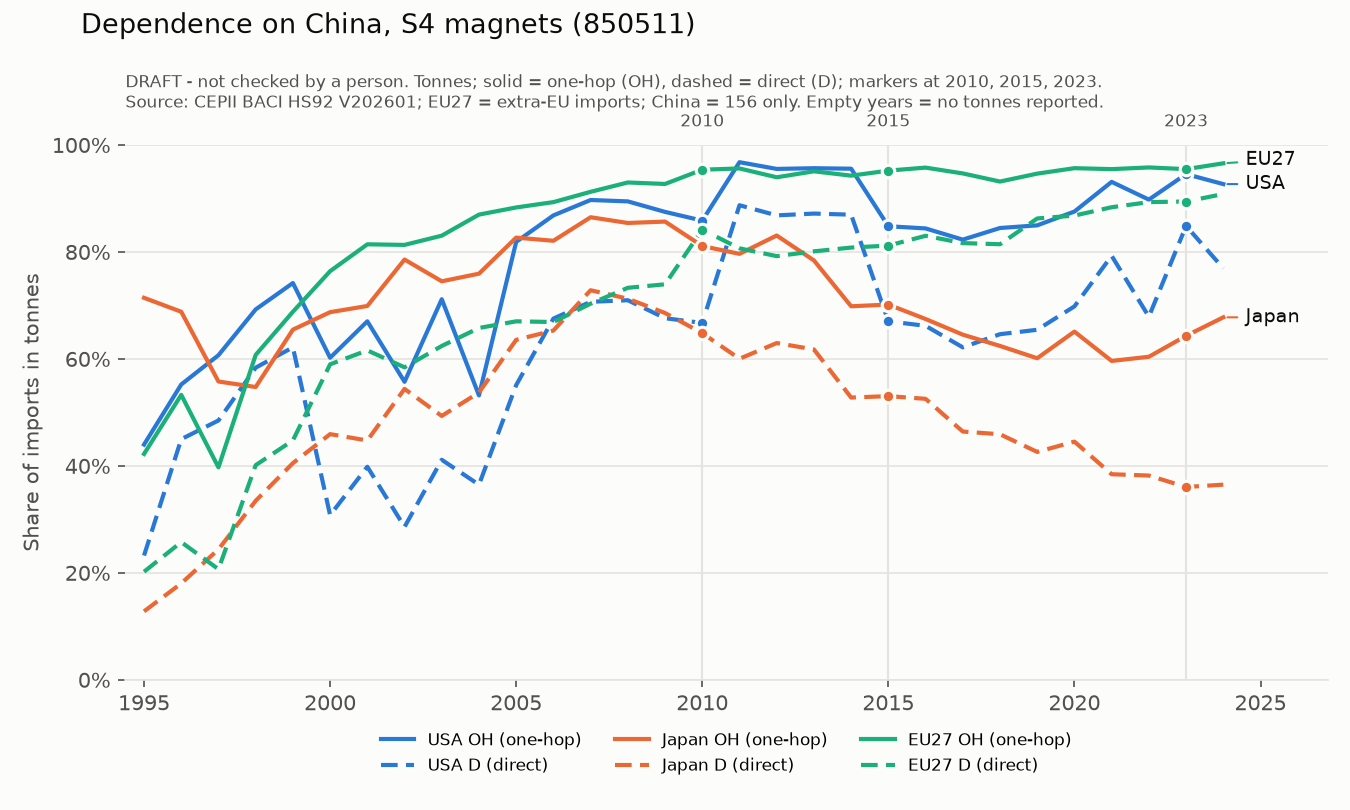
After 2010, Western direct dependence falls upstream but barely moves for magnets, and one-hop dependence falls less than direct dependence. Japan is the counter-case: partial sovereignty when policy targets one stage with sustained public money.
What we expected, and why
Our project framework's historical background describes a monopoly the West co-produced and did not contest until 2010. Contestation then came through the Japan shipment halt and the 2012 WTO case. The framework concludes that "building its own chain is costly", and that without upstream capacity "the West will depend on China for finished products". So we expected diversification to show upstream first and hardly at all for magnets. The framework counts Japan as part of "the West" for its role in cooperation initiatives and in contesting Chinese policy, which makes it the natural counter-case.
What would confirm it
After 2010, Japan's direct dependence on Chinese magnets falls but its one-hop dependence falls less, while US and EU magnet dependence stays roughly flat.
What would contradict it
US or EU magnet dependence drops sharply, or one-hop and direct dependence move together.
Japan: its direct dependence fell by 29 points but its one-hop dependence fell by only 13. The hidden layer (one hop minus direct) roughly doubled, from 16 to 31 points. In 2024, 73% of that layer ran through Vietnam.
US and EU: magnet dependence did not fall; it rose, both direct and one hop.
Upstream (ores, S1): US and EU direct dependence was already low (11% or less in every year shown). Japan's fell from 66% in 2010 to 17% in 2024.
Caveat 1, the unit matters: measured by value, Japan's direct magnet dependence barely moved (32% in 2010, 27% in 2024).
Caveat 2, the placebo: non-rare-earth magnets (HS 8505.19) show a similar hidden layer in 2024: Japan 77% direct and 97% one hop, the US 56% and 80%, the EU 85% and 98%. So part of the one-hop layer reflects China's weight in manufacturing generally, not rare-earth policy.
Caveat 3, a likely undercount: one-hop figures may be too low where partner countries record no imports of their own (up to 16% of imports in the standard calculation).
Verdict: Partly confirmed. Japan behaves as the counter-case in tonnes but not in value. US and EU magnet dependence did not just stay flat, it rose. The placebo shows the hidden layer is not specific to rare earths.